
Forex Basics - Technical Analysis

-
Forex Basics - Course
-
Chart Patterns!
One of the key elements of Forex are chart patterns. In the following tutorial, you will learn them, and become well protected from unexpected treacherous trend reversals, false breakouts, extreme swings, and troughs.
 Chart patterns are the combination of support and resistance lines which help to determine whether the trend
will reverse or continue. As a result, there are Reversal and Continuation Patterns.
Chart patterns are the combination of support and resistance lines which help to determine whether the trend
will reverse or continue. As a result, there are Reversal and Continuation Patterns.
Reversal Chart Patterns:
Head and Shoulders:
The head-and-shoulders pattern is usually formed at the end of an uptrend. While the bullish trend is seen as
a period of successive rising peaks and rising troughs, the head-and-shoulders pattern illustrates a weakening
in the trend.
The pattern consists of a head (the second and the highest peak) and 2 shoulders (lower peaks) and a neckline (the line which connects the lowest points of the two troughs and represents a support level). The neckline may be either horizontal or sloping up/down. The signal is more reliable when the slope is down rather than up.
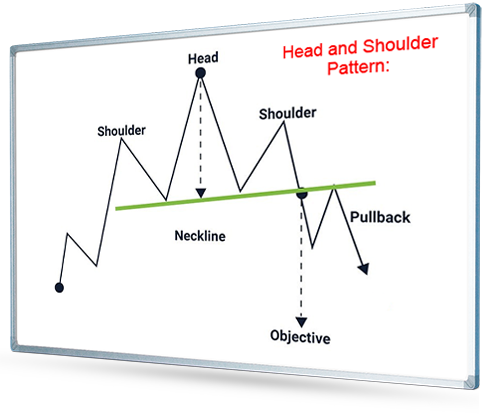
The pattern is confirmed when the prices broke below the neckline after forming the second shoulder. Once it happens, the currency pair should start a downtrend. So, a sell order is put below the neckline. To get the target measure the distance between the highest point of the head and the neckline. This distance is approximately how far the price will move after it breaks the neckline.
Note that prices often returns to the neckline after the initial breach (a "throwback" move). In this case, the neckline, which used to be a support, acts as resistance.
Inverse Head and Shoulders:
The inverse head-and-shoulders pattern is the exact opposite of the head-and-shoulders. It occurs at the end of
a downtrend and indicated a bullish reversal.
Double Top:
The double top is also usually formed at the end of an uptrend. It is one of the most common formations. The
pattern consists of two consecutive peaks of similar (or almost) height with a moderate trough between them.
The neckline is drawn horizontally through the lowest point of a trough.
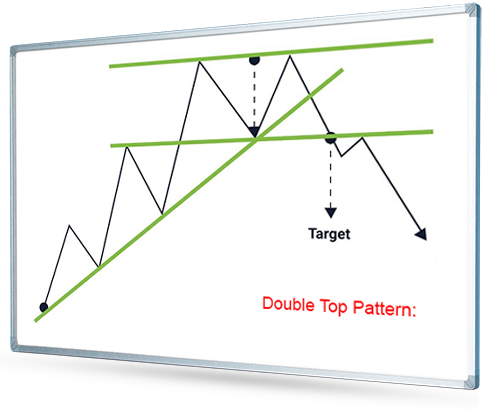
The pattern is confirmed when the prices break below the neckline after forming the second shoulder. Once it happens, the currency pair should start a downtrend. Put a sell order below the neckline. To get the target measure the distance between the peaks and the neckline. This distance is approximately how far the price will move after it breaks the neckline. Once reached, the neckline starts acting as resistance. Throwback move is also possible here.
Double Bottom:
The double bottom is the exact opposite of the Double-Top. It occurs at the end of a downtrend and
indicated a bullish reversal. The similar patterns with 3 peaks / 3 troughs are called Triple top / bottom.
Trading should be the same.
Continuation Chart Patterns:
Continuation chart patterns occur during a pause in the current trend and indicate that it will resume.
Triangles:
Triangle patterns are easily recognized. The best way to trade them is to trade the breakouts. Trading inside
the triangle is riskier and requires experience.
There are 3 types of triangle patterns. "Ascending Triangle" is considered to be a bullish pattern, "Descending Triangle" – a bearish pattern, while "Symmetrical Triangle" – a neutral one.
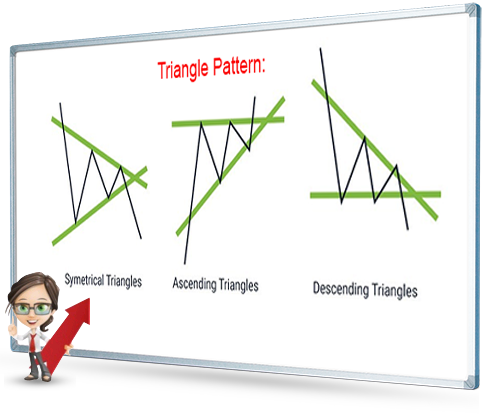 In the case of a symmetrical triangle, neither bull nor bears dominate the market. Support line slopes upwards
and resistance line slopes downward at approximately one angle. The breakout may be in any direction. One sure
thing is that it will eventually happen. As a result, one may place entry orders above the lower highs and below
the higher lows. When one of the orders is hit, cancel the other.
In the case of a symmetrical triangle, neither bull nor bears dominate the market. Support line slopes upwards
and resistance line slopes downward at approximately one angle. The breakout may be in any direction. One sure
thing is that it will eventually happen. As a result, one may place entry orders above the lower highs and below
the higher lows. When one of the orders is hit, cancel the other.
The ascending triangle shows that the bulls are getting stronger as they manage to push the prices up to one level, while the Bears are weakening and allow the prices to form higher lows. Resistance line is relatively flat or horizontal and support line is sloping upwards. In most cases, but now always, the price will break out past the resistance. Set entry order above the resistance line and below the higher lows.
The descending triangle shows that the bears are getting stronger as they manage to pull the prices down to one level, while the Bulls are weakening and allow the prices to form lower highs. Resistance line is sloping downwards and a line of support that is relatively flat or horizontal. In most cases, but now always, the price will break out past the support. Set entry order below the support line and above the lower highs.
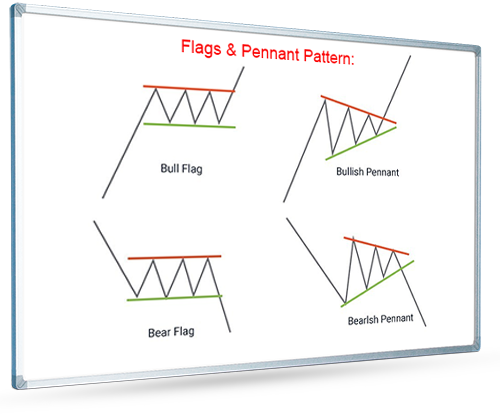
Flags and Pennants:
Flags and Pennants are short-term continuation patterns of which they are among the most reliable. These patterns
are formed when there is a sharp price movement followed by a consolidation phase. A flag consists of 2 parallel
trendlines (support and resistance) that slope against the previous trend. A Pennant consists of two converging
trend lines that begins wide and converges and is a very short term Symmetrical triangle. Always trade Flag and
Pennants in the direction of the previous trend placing orders above the resistance line (for uptrends) or
support line (for downtrends).
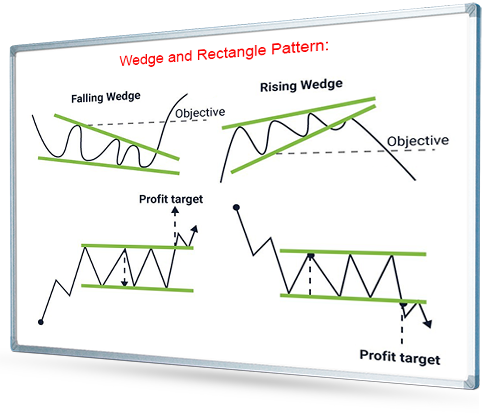
Wedges:
Wedges are much similar to triangles. The difference is that wedges have a significant slope against the
previous trend.
A rising wedge is formed when price consolidates between upward sloping support and resistance lines. If the rising wedge forms after an uptrend, it is usually a bearish reversal pattern. If it forms during a downtrend, it could signal a continuation of the down move.
A falling wedge is formed when price consolidates between downward sloping resistance and support lines. If the falling wedge forms after a downtrend, it is usually a bullish reversal pattern. If it forms during an uptrend, it could signal a continuation of the up move.
Rectangles:
Rectangle describes a price pattern where supply and demand seem evenly balanced for an extended period of time.
The currency pair moves in a tight range, finding support at the rectangles bottom and hitting resistance at the
rectangles top. The prices will eventually break out of this sideways trade. The breakout will most likely be to
the upside if the previous trend was bullish, and to the downside, if the previous trend was bearish. However,
the rectangle can become a reversal pattern.
-
Forex Basics - Course
-