
Forex Basics - Technical Analysis

-
Forex Basics - Course
-
Trendline Analysis!
One of the assumptions of technical analysis is that the price moves in trends. Let's find out more about these trends.
A trend is the general direction of the price of an asset on the market. If you look at a chart of any
financial instrument, you will see that prices never move in straight lines, they are constituted of a series
of highs and lows. More often than not a price has an upward or downward bias.
Types of Trend:
There are three types of trends:
- Uptrend: A Bullish Trend consists of a series of "Higher Highs" and "Higher Lows" (prices are moving up). One may speak about an uptrend if there is a clear support line, connecting at least two lows and limiting the downside. A break below this line signals trend's weakness or reversal.
- Downtrend: A Bearish Trend is classified as a series of "Lower Lows" and "Lower Highs" (prices are moving down). A downtrend can be defined if there is a clear resistance line, connecting at least two highs and limiting the upside. A break below this line signals trend's weakness or reversal.
- Sideways: A flat, horizontal Trend – there is no well-defined trend in either direction.
In terms of length, trends can be classified as:
- Long-term (6 months – 2.5 years): A major trend which can be traced on a weekly or monthly charts. It is composed of several medium-term and short-term trends, which often move against the direction of the major trend.
- Medium-term (1 week – a couple of months): Is better seen on the daily and H4 charts.
- Short-term (less than a week): Is better seen on hourly and minute charts.
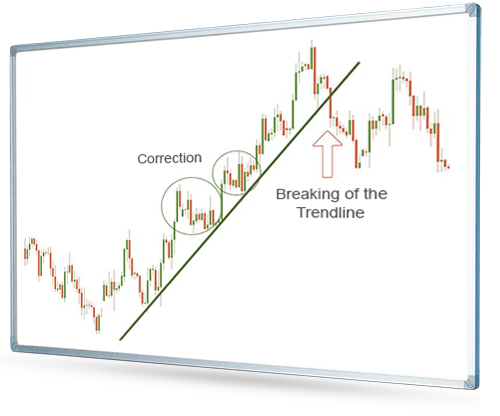 Every trend consists of movements in the direction of this trend which are intermitted by counter-trend moves
called "Retracements" or "Corrections". A trend is expected to continue until a
reversal takes place and the direction of a trend changes.
Every trend consists of movements in the direction of this trend which are intermitted by counter-trend moves
called "Retracements" or "Corrections". A trend is expected to continue until a
reversal takes place and the direction of a trend changes.
Trendlines:
A favorite saying of traders is "A trend is your friend". The idea behind this phrase is that traders can make good profits by following a trend, i.e. trading in the direction of a trend (buying during an uptrend and selling during a downtrend).
In order to determine which trend is there at the market, traders draw trendlines and use technical indicators. A trendline is a line drawn through "highs" or "lows" of the price chart to show the prevailing direction of price. As such line connects the already formed peaks and troughs of the price, it can be continued (projected) to the right of the current price. It is assumed that this line will be an obstacle for the price in the future.
On the picture above you can see the trendline drawn through a price's low and a higher low in an uptrend. The price respected the trendline for some time continuing moving within a rising trend. Then it broke below the trendline. This was a sign that the uptrend finished and the market reversed down. Those traders who opened buy trades during the uptrend closed their positions and opened sell trades.
-
Forex Basics - Course
-