
Forex Basics - Charts and Candles

-
Forex Basics - Course
-
Reading A Trading Chart!
Charts are the heart of trading. In addition to helping traders monitor the value of their current positions, they also help traders see where price has been, and in doing so, provide clues as to where price will go. As such, understanding how to read a price chart is a key step in the journey to becoming a trader.
The first concept to understand is that price shows the behavior of price relative to time.
Time (Left to Right):
 The time component of a price chart is read on the x-axis (left to right). The further left we look, the more into
the past we are looking. The latest candle or bar represents the current time period. Each candle or bar represents
one unit of time. At the top of price charts is typically a setting that allows you to modify what one unit of time
represents. If the timeframe is set to "Daily", this means that each candle or bar represents one
day's worth of price activity. If it is set to "5 minutes", this means each candle or bar represents
5 minutes of price activity.
The time component of a price chart is read on the x-axis (left to right). The further left we look, the more into
the past we are looking. The latest candle or bar represents the current time period. Each candle or bar represents
one unit of time. At the top of price charts is typically a setting that allows you to modify what one unit of time
represents. If the timeframe is set to "Daily", this means that each candle or bar represents one
day's worth of price activity. If it is set to "5 minutes", this means each candle or bar represents
5 minutes of price activity.
Price (Top to Bottom):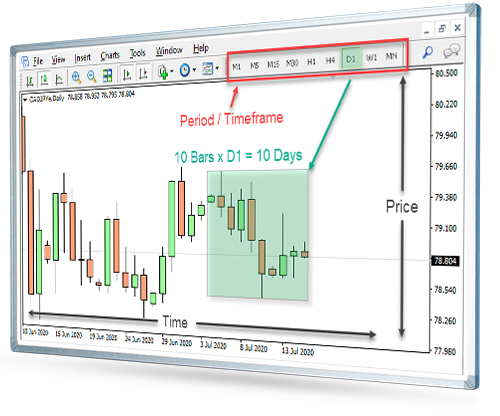
The price of an instrument is read on the vertical axis. The higher a candle or bar is, the higher price was during that time period. Conversely, a candle or bar near the bottom of the chart shows a relatively low price.
Price Information
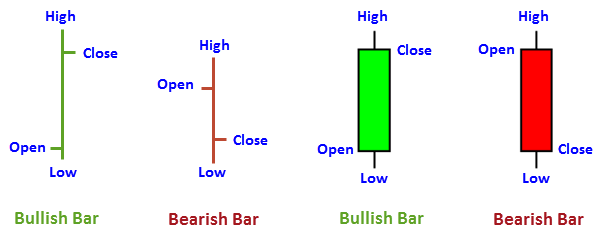
The 3 most common and basic forms of price chart are: "Line Chart", "Bar Chart", and "Candlestick Chart". On a candle or bar chart, each unit on the chart shows four elements:
- OPEN PRICE:
This is the price that started the period. In a bar chart, a horizontal line to the left denotes the open price. In a candle, the lower part of the body of the candle is the open if the candle is not red, or some other color that denotes a lower close than open. If the color of the candle is red, or another color that denotes a higher close than open, the high of the body signifies the open. - HIGH PRICE:
The highest price traded during that period. - LOW PRICE:
The lowest price traded during that period. - CLOSE PRICE:
The price closed at for that period. Color is used as differentiate between open and close.
-
Forex Basics - Course
-