
Unregistered
or


File Download requires verified Account!
Please Note that you need to Login first and verify your Account in order to download a file!
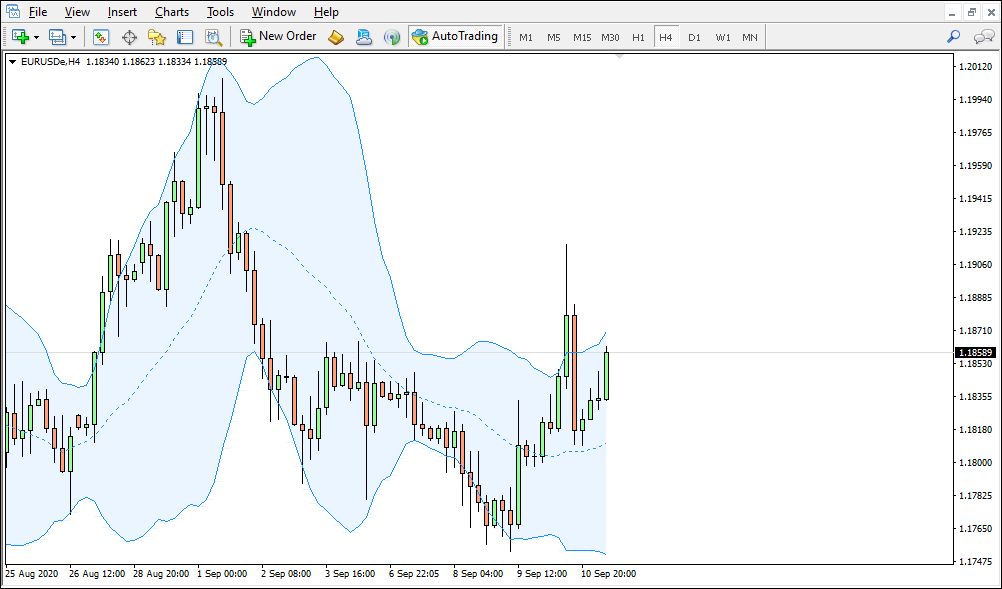
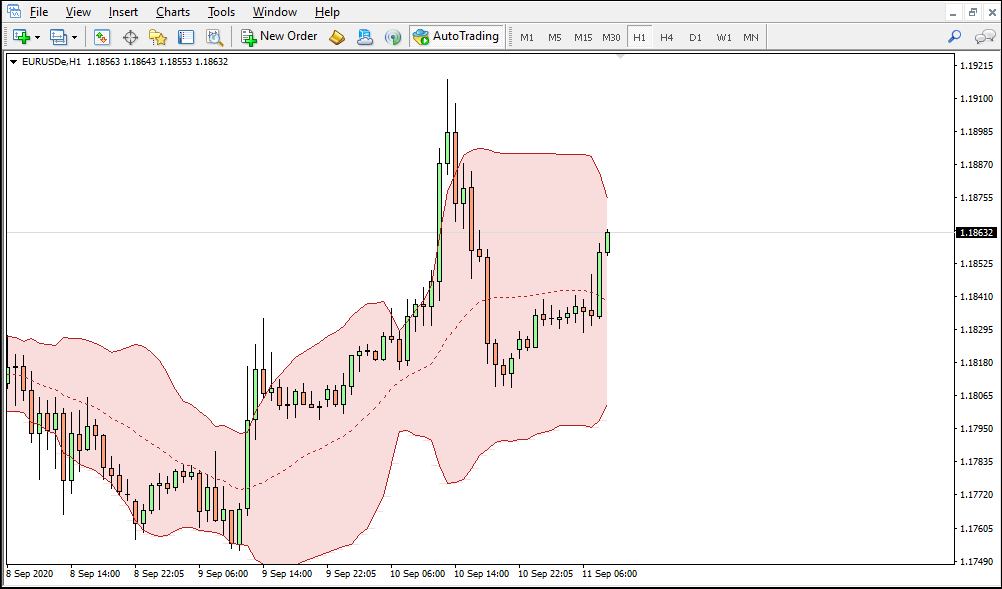
The Bollinger Bands are useful indicators that appear in most charting packages. They are commonly used in Forex because they convey several useful pieces of information: such as trend, volatility and high/low price anomalies.
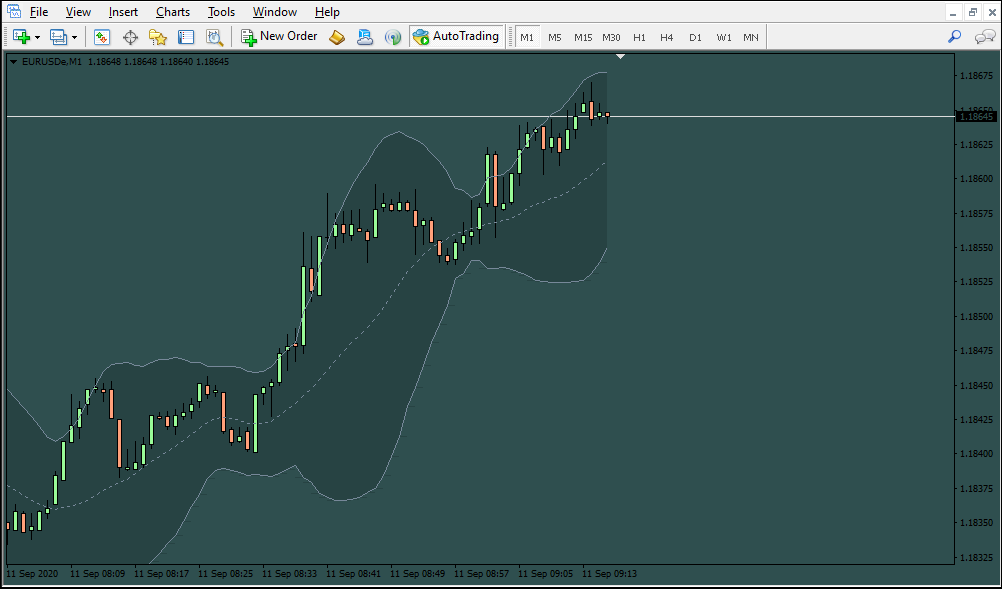
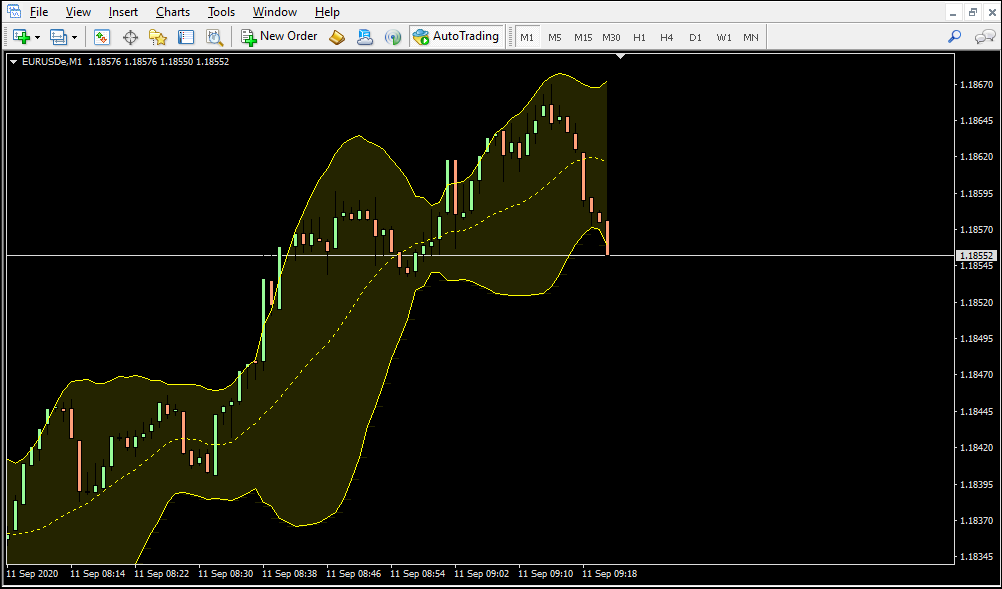
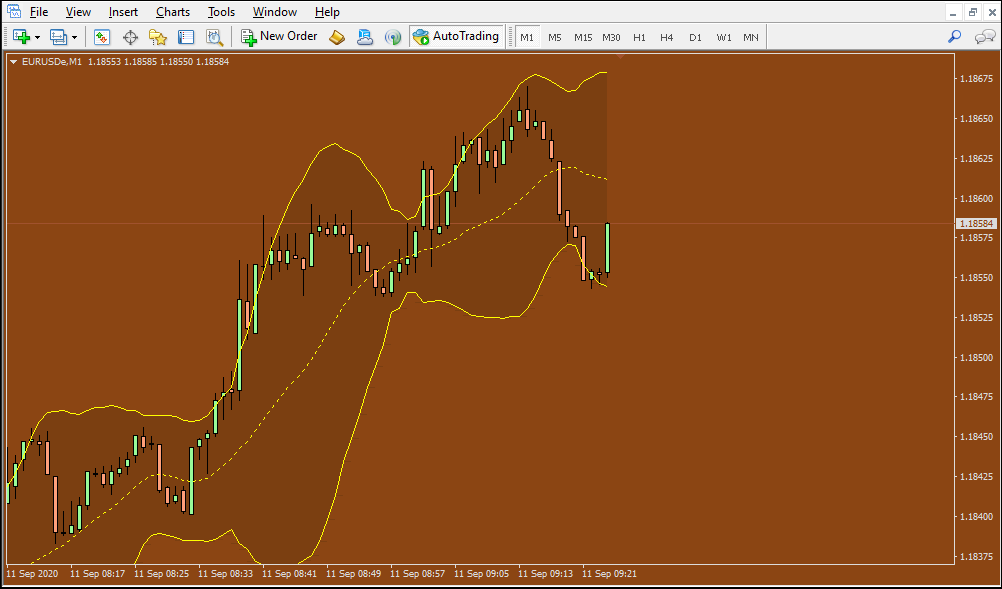
The Bollinger Color Bands version supplies you with the possibility to set a color for the Bands area to easily visualize the bands!
Bollinger bands actually comprise three separate indicators and each tells you something about the price activity at a current point in the chart. The three distinct elements of the Bollinger indicator are:
The main line is a moving average of the price. It is calculated in the same way as a conventional moving average. It simply displays a smoothed version of the price and is useful for giving the broad directional trend of the market.
With a standard Bollinger indicator, the upper and lower lines run symmetrically. In other words the main line always runs an equal distance between the upper and lower lines. The upper and lower lines are useful for indicating overbought and oversold conditions.
Finally, the bandwidth is the distance between the upper and lower lines. The bandwidth is a measure of volatility. The more choppy the price action, the greater the bandwidth will be. This is because it dependent on the standard deviation, which is simply a measure of how far the price is deviating from the average. The bandwidth is useful for detecting periods of contracting or rising volatility.
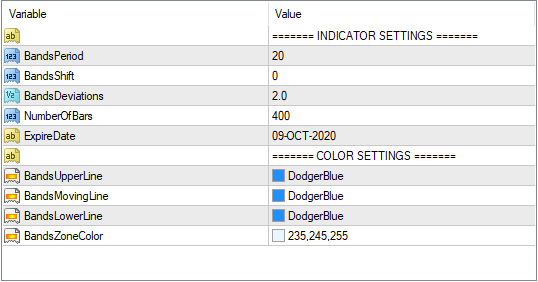
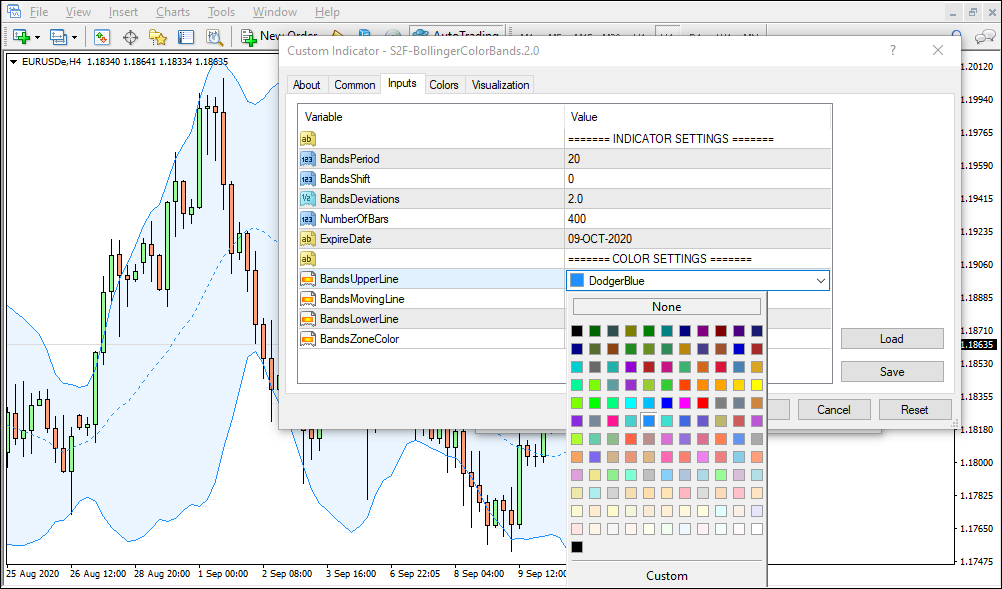
When loading the chart trading tool to your chart, you will be presented with a set of options as input parameters. All parameters are grouped into self-explanatory blocks.
Explainer Video of the Bollinger Color Bands functionallities! (About 5 minutes).

or
Werner123
Aug 10, 2020 | 23:00:36
Test
Reply