
Forex Basics - Charts and Candles

-
Forex Basics - Course
-
The Candlestick Chart!
Candlestick chart is one of the chart types used in financial markets. It originated in Japan two centuries ago and has long since won the hearts of traders all over the world. Japanese candlesticks can tell a lot about the behavior of market participants. Candlestick chart itself is a powerful analytical tool.
The Structure of a Candlestick:
A single candlestick shows the dynamics of the price during a particular period of time. If you are looking at the weekly timeframe, each candlestick stands for a 1-week change in the price. If you are at the M5, each candlestick corresponds to 5 minutes of the price action.
A candlestick consists of a "body" (the area between the open and the close prices) and an upper and a lower "shadow" (the vertical lines above and below the real body), which are also referred to as "wicks" and "tails". The wicks pinpoint the highest and lowest price during the time span of a candlestick.
If the prices rose during the time period, the candle is usually painted in white or green. In this case, the opening price at the bottom of the body and the closing price is at its top.
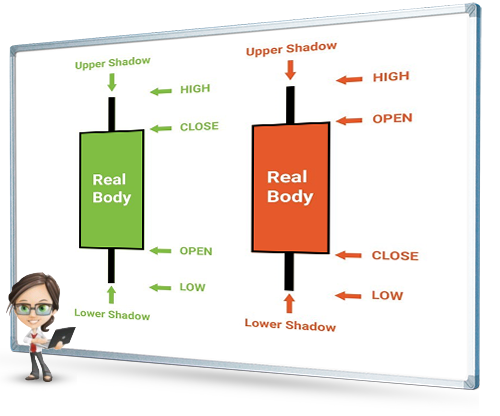 If the prices fell during the time period, the candle is usually painted in black or red. In this case,
the opening price at the top of the body and the closing price is at its bottom.
If the prices fell during the time period, the candle is usually painted in black or red. In this case,
the opening price at the top of the body and the closing price is at its bottom.
Types of candlesticks:
At the first scheme, you can see the regular candlesticks. However, the shapes and sizes of candlesticks may vary greatly and can tell a lot about the nature of the price action.
For instance, the longer the candlestick body, the stronger the trend is. Short candlesticks, on the contrary, indicate little price movement and represent consolidation.
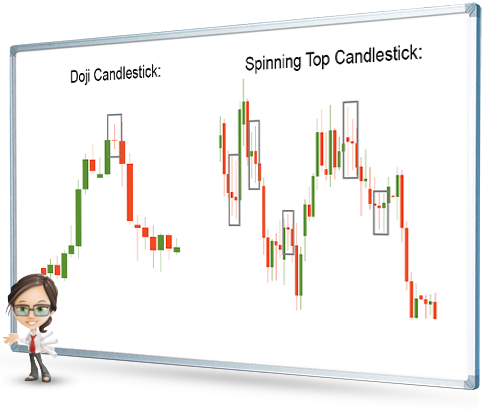
The Doji Candlestick:
A candlestick with a very small body (open and close are virtually equal) is called "Doji". All in all, it's a sign of the market uncertainty because neither bulls nor bears managed to make the price close at their territory. On its own a doji is neutral. However, if a doji forms after a series of bullish candles with long bodies, it signals that buyers are becoming exhausted and weak and the price may reverse down. If a doji forms after a series of bearish candles with long bodies, it means that sellers are getting tired and the price may turn up.
Candlesticks with Short Shadows:
Candlesticks with short shadows indicate that most of the trading action was confined near the open and close. Candlesticks with long shadows show that prices extended well past the open and close.
Candlesticks with a Long Upper Shadow:
Candlesticks with a long upper shadow and short lower shadow indicate that buyers dominated during the session, but by the end of the period sellers managed to pull prices down from their highs. Candlesticks with long lower shadows and short upper shadows indicate that sellers dominated during the session, but by the end of the period buyers managed to push prices higher.
Spinning Tops:
Candlesticks with long both upper and lower shadows and small real bodies are called "Spinning Tops". Spinning tops are the signs of the market's indecision: both bulls and bears were active, but neither manages to sustain gains. After a long advance or long bullish candlestick, a spinning top indicates weakness among the bulls and a potential change or interruption in trend. After a long decline or long bearish candlestick, a spinning top indicates weakness among the bears and a potential change or interruption in trend.
-
Forex Basics - Course
-