
Forex Basics - Charts and Candles

-
Forex Basics - Course
-
The MT4 Market Watch!
 The Market Watch displays all the different instruments that you can trade – including forex pairs, indices,
precious metals and energies – and displays the instrument symbol alongside the current bid and ask prices.
The Market Watch displays all the different instruments that you can trade – including forex pairs, indices,
precious metals and energies – and displays the instrument symbol alongside the current bid and ask prices.
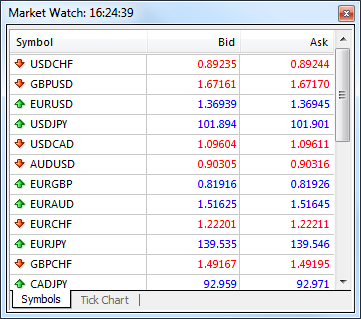
By right-clicking on a particular symbol you’ll have access to a range of options, such as:
- New Order: This will open a trade on the selected instrument.
- Chart Window: This will open a new chart of the selected instrument.
- Tick Chart: This is the sales activity for the currency pair.
- Depth of Market: This displays the bid and ask prices for a particular instrument at the current best prices (closest to the market).
- Specification: This shows the contract specifications of the instrument, such as spreads, contract size and swap rates.
The Chart Window:
The chart panel shows the price movement of an instrument, and is the most recognisable part of any trading platform. The charts can be displayed in different means – either as candlesticks, price bars or line charts, and you can even view multiple charts on one screen at the click of a button if you’re tracking multiple markets.
The charts can be viewed in different timeframes, from "1 minute charts" right through to "1 month charts". A 1-Minute chart simply means that each candlestick, bar or line displays one minute of movement. Likewise, with a monthly chart, each candlestick, bar or line shows one month of movement.
Marking up a chart with vertical, horizontal and trend lines, text and arrows is simple, and these are vital tools you will regularly use if you plan to analyse the charts.
In our "Smart Trading Toolbar", you will find preformated Objects for placing on the MT4 chart to mark trends and setups perfectly!
-
Forex Basics - Course
-